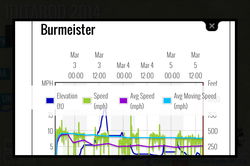
What happens when you don't put a cap on what young children can learn and understand? You are astounded by their skills and knowledge, that's what. Today, we looked at the Iditarod site to check in on our mushers. We decided to cruise around together as a class and check out other things on the site. One of the things we came across was the Analytics View tab within the GPS tracking. At first glance a person could think that this information was too high level for first graders but I know the level of engagement of my kids and so I took a leap of faith. I showed them Aaron Burmeister's data. We made some assumptions about what it was showing us. We looked mostly at elevation (blue) and speed (green). Then I showed them the data from the musher I am following, Aliy Zirkle. I talked about what I could surmise from the data. Afterwards I gave each group a paper copy of the data for their musher and asked them to sit together and discuss what they could assume based on what they were seeing. I asked each group to find 2 ideas to share with the class and to choose people to speak on their behalf. Once they had the time to review the data and come up with the group's 2 ideas, they presented their thoughts to the class. Their videos are below. I could not believe the ideas they had developed and shared. (Just a reminder: these are first graders who have never seen this kind of data in this kind of format prior to today.) I was so proud of them!

 RSS Feed